


revenue
Sales
Sales by Team · Team Performance Over Time · Sales by Services · Sales by Clients

Altegio turns every appointment, sale and cash operation into named reports, so you see what the month actually earned, who brings it in and where it leaks – and act on it while it still matters
7-day free trial · onboarding with an expert · no credit card required
Attendance
Clients
861
↑ 11%
View clients ↗
Visits
1052
↑ 4%
Total amount
Appointments
976
↑ 12%
Total amount
New clients
Returning clients
Lost clients ·
16
Occupancy
Completed
657
↑ 2%
60% of all
Cancelled
5
↓ 3%
1% of all
Working time occupied
No-shows
Average ·
50
per day
Individual and Chain Reports
a report set for each location, and a chain set that compares them on the same rules
Rules that follow your workflows
the lost-client period, monthly revenue plans and who sees which report are yours to set
KPIs for every team member
track each person’s efficiency, from earnings and average bill to how booked they were
All numbers are explainable
every added, changed or deleted appointment, payment and stock operation is logged
Without Altegio I couldn't have got at the retention figures, specialist by specialist. Altegio has definitely helped me work with my team: all those numbers, showing specialists their own retention, the ramp-up history of a specialist – at 7 days, at 2 weeks, where they are 2 months in. And it works out exactly how to motivate a specialist to earn more on client volume, how to read the average bill. It works brilliantly, and it works fast

Analytics fills itself from the work your team already does – nothing to set up, nothing to import
01
Appointments, sales and cash operations become report data as the day goes on – no end-of-day typing
02
Every report takes a date range; most add filters, down to one team member, one service, one location
03
Client metric cards on Main Dashboard carry a View clients action, which opens the list of clients behind that number
No finance background needed: the reports are ready-made and the period is a date range
Sales
Total
€2.01K
36 Operations
Services
€1.73K
36 Sold services
Products
€282
14%
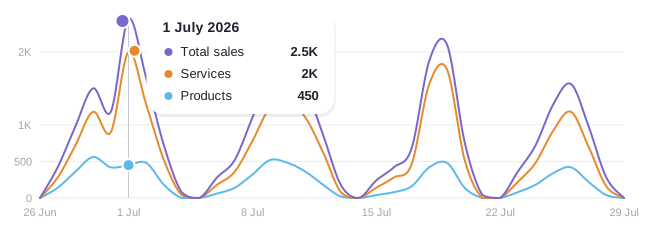
Total sales
Services
Products
Average visit cost
€55.75
Average service cost
€47.92
36 Sold services
Average product cost
€23.50
14%
*Does not include prepayments, such as sales of memberships/gift cards and client account top ups
Every report you have, cataloged and grouped by category – whatever appointment-based business you run, the report you need already exists and is named
revenue
Sales by Team · Team Performance Over Time · Sales by Services · Sales by Clients

workload
Main Dashboard, consolidating Sales, Attendance and Occupancy · Team Occupancy · Client Retention

the calendar
Appointments · Events – every appointment and group event, with status, source and creator

money
Financial report · Profit & Loss · Daily cash desk report

stock
Sales Analysis · Consumable Usage Analysis · Write-off Analysis · Inventory balance · Product Orders

people
HR report · Promotions Effectiveness · Messages, with the notification module connected · Call Logs, with an IP-telephony integration connected

audit trail
Activity Logs · Change Logs – who downloaded, added, changed or deleted what, and when

several locations
Summary Report · Breakdown by Locations · Breakdown by Days · Breakdown by Parameters · chain Team, Services and Appointments · Report on memberships · Revenue Plans
swipe through the eight report categories →
Run a real week and every report on this list fills with your own numbers
Revenue, expenses and what is left – three finance reports answer the month, from the day to the year
the period
All income and expenses for the period you set, opening on the last week by default. This is the report to reconcile a month against
the year
Income and expenses month by month across the year, with several months compared
the day
A daily report generated automatically, covering cash encashment and transfers, while the team that worked the shift is still there
the split
Main Dashboard’s Sales section, with the total split into services and products
The ledger behind these numbers lives in Finance and accounting
Work a real month and these three reports write themselves
Retail is a second business inside yours – and it has its own set of reports
What sold, in what quantity, over the period. Opens from Inventory > Analytical Reports, like the rest of this set
What the work consumed, so a service cost is not a guess
What left the shelf without being sold
What is on the shelf now, read per location
What is ordered and what is on the way
Which service is in demand and which brings more revenue
For a chain, the Services report adds profit and consumables cost per service. A car service reads it to see whether a fully booked bay was a profitable one
What each team member brought in, and how booked they actually were – the difference you cannot see from the calendar

What each team member earned in a period, and across which metrics

One team member month by month: services and amounts, appointments, average bill, products sold
How booked each team member actually was, over any period you pick

Whether the clients who saw one team member came back

New hires, employment periods and dismissals, when the question is the team rather than sales

Payroll charts with a standard rule, calculation criteria, bonuses and deductions, set in Payroll
swipe through the team reports →
A clinic with two doctors in the same specialty reads two reports side by side: Sales by Team says who earned more, Team Occupancy whether the difference is hours booked
Every appointment in the company – any source, any user, any status, deleted ones included – with how many cancelled and where they came from
Reports > Appointments filters by creation date, visit date, team member, client name or phone, service and appointment category
Filters for cancelled and for visit status, so you count how often it happens instead of guessing
Payment status is a filter on the same report: paid, unpaid or all
The source filter separates all, online and offline appointments, and names the user who created each one
The Events report gives group events the same treatment, with the same statuses
Put your Google Analytics and Facebook Pixel identifiers in the Online Booking widget settings
A slow Tuesday stops being a mystery: you can see how many were booked, how many cancelled and where the rest came from
New, returning and lost – with the names behind every number, and the definition of ‘lost’ yours to set
The lost-client period is a setting. Analytics > Settings > Client Churn holds it. Change it and Client Retention follows
Client Retention shows the results of your team’s work with clients, per team member too
Returning clients works differently, on purpose. It counts the entire previous period, so the earlier visit could be a month or a year old, and it ignores the churn setting
Sales by Clients lists revenue and visits for every client in the period, which is where your biggest spenders are
Promotions Effectiveness shows how many new clients a promotion brought, and how many came back
Report on memberships lists, for a chain, the memberships valid across it
Client type:
New
Returning
Lost
Expiring membership ✕
Name
Last name
Phone
Total sales
Visits
George
Bennedict
+374 93 …
2,825.57 €
21
Johnny
Reyes
+374 88 …
261.36 €
9
Bob
Carter
+225 66 …
176.00 €
7
Patrick
Johnson
+374 96 …
128.37 €
5
Anna
Lindqvist
+386 4 …
114.84 €
3
Hannah
Whitmore
+374 99 …
8.47 €
2
Start working with your client base like a pro
Every metric has a counting rule, so two reports can differ without either being wrong – once you know which answers your question
Visit-based reports count Arrived visits. Sales by Team, Sales by Clients and the chain Team report read appointments with the Arrived status. The Financial report and Profit & Loss read income and expenses, which is why the two differ
Main Dashboard’s Attendance metrics count only Arrived appointments, and exclude appointments with no client attached
Prepayments are not counted there: memberships, gift cards and account top-ups arrive before the service does
Chain average spend is not revenue divided by visits. It counts only visits and product sales that carry a phone number
Analytics permissions are granted per team member: without the permission, a team member sees neither the report nor the section holding it. Appointment and message logs are granted separately, so the front desk keeps its tools while revenue stays yours
Analytics
Revenue
Appointments
Occupancy
Cancelled
64
↓ 3%
% of all
Total appointments
1668
↑ 28%
Change
New clients
24
(52%)
Repeat visits
14
(33%)
Lost clients
5
(13%)
A separate set of chain reports – compare locations, or drill into one, without merging a single file by hand
Consolidated key chain metrics
Locations compared on revenue, average check, occupancy and client activity
The same metrics date by date, enough to tell a seasonal dip from a bad week
One metric across all locations, dates as columns, locations as rows
Revenue per team member, service performance by type or subdivision, and every appointment with its location, status and source
A monthly plan per location, read against Total Revenue and the percentage completed
Set by the main location of the chain, so the totals compare
swipe through the chain reports →
Five wellness studios read two in sequence: Breakdown by Locations ranks them, then Breakdown by Days on the weakest shows which days are costing it
One set of reporting rules for one location or fifty – start with yours
Excel for the accountant, API or Power BI for your BI, the phone for you – reports leave Altegio in four directions
Named reports carry an Export to Excel button, Client Retention and the chain Breakdown by Parameters among them
Downloads from All Clients, Reports – Appointments, Financial Transactions and Inventory Management are recorded, so you know what left the system and when
Who added, edited or deleted an appointment, a financial operation or a stock movement, and when – so a figure that moved can be traced to the action that moved it
An integration with API access reads your clients, appointments and services, within the rights of the user who granted it
A stand-alone business-intelligence service listed in Integrations, which is the route to Power BI dashboards
The Altegio Business Management mobile app carries an Analytics tab: end of day, daily and period reports, tappable charts, a monthly workload calendar
One caveat before you rely on the phone. The mobile report is not a financial report, does not reflect actual cash flow, and may not match the daily report
Close the month on the figures Altegio counted, not on what you remember – nothing separate to set up or learn
7-day free trial · onboarding with an expert · no credit card required
Six questions owners ask before they switch
Altegio does: Analytics is one of its sections, next to the calendar, Clients, Finance and Inventory. Open Analytics > Analytical Reports and pick from the full catalog; the inventory and finance report sets live in their own sections of the system
Because each metric carries its own rule. Visit-based reports such as Sales by Team count only appointments marked Arrived. The finance reports add up income and expenses instead. Neither is wrong; they answer different questions, so pick the report by the question
Yes. The button sits on the reports themselves – Client Retention and the chain Breakdown by Parameters carry it, among others. Excel is the file your accountant or bank asks for, and Activity Logs keeps a record of every download from four sections
Yes. Reports are permission-gated per person: grant the permission and anyone without it simply never sees those numbers or the section holding them. The appointment and message logs take a permission of their own
Yes. Open the Analytics tab of the Altegio Business Management mobile app for the day just closed, any single day or a period, with charts you can tap into. Treat it as an operational view rather than a financial report
Through Integrations, not a built-in connector. Grant an integration API access and it can read your clients, appointments and services – never more than the user’s own rights allow. For Power BI specifically, the route is Smart-Metrika, a stand-alone business-intelligence service
These are the parts that write to the reports and read from them