
What is it and why is it needed? #
In Analytical Reports > Main Dashboard, you can find consolidated analytics data for the following metrics:
- Sales
- Attendance
- Occupancy
This report helps you quickly assess financial performance, client activity, and how effectively your team’s working time is being used.
Important
Analytics are calculated only for visits with the status “Arrived” within the selected period.The percentage icons with arrows next to each metric show the change compared to the previous period of the same length.
Visits with the status “Arrived” that include services/products but do not have a phone number are not counted as clients and are not included in the metrics for new, returning, and lost clients.
How to use the report #
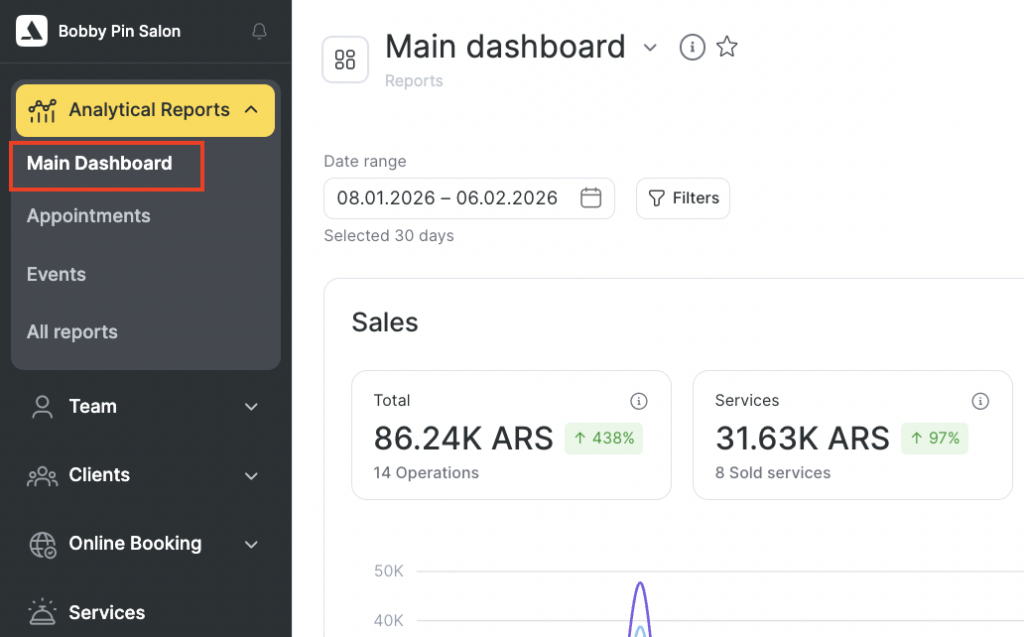
- To generate the report, switch to Administration mode and go to Analytical Reports > Main Dashboard.
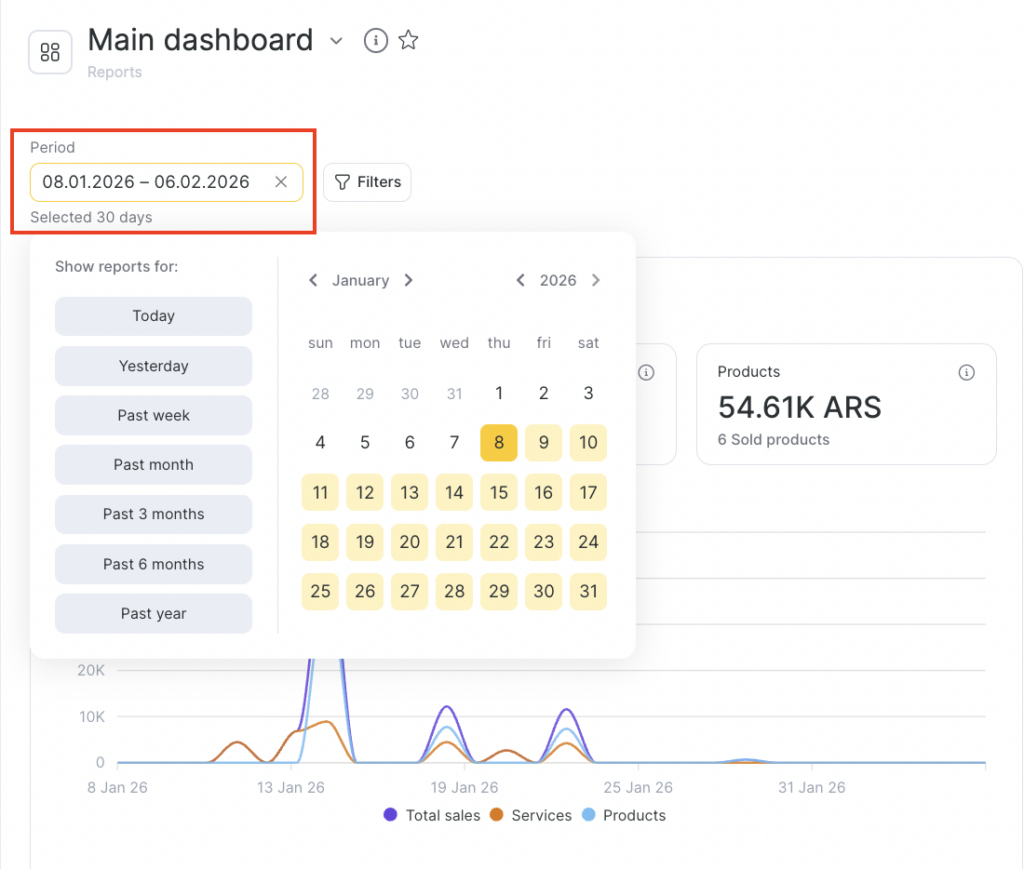
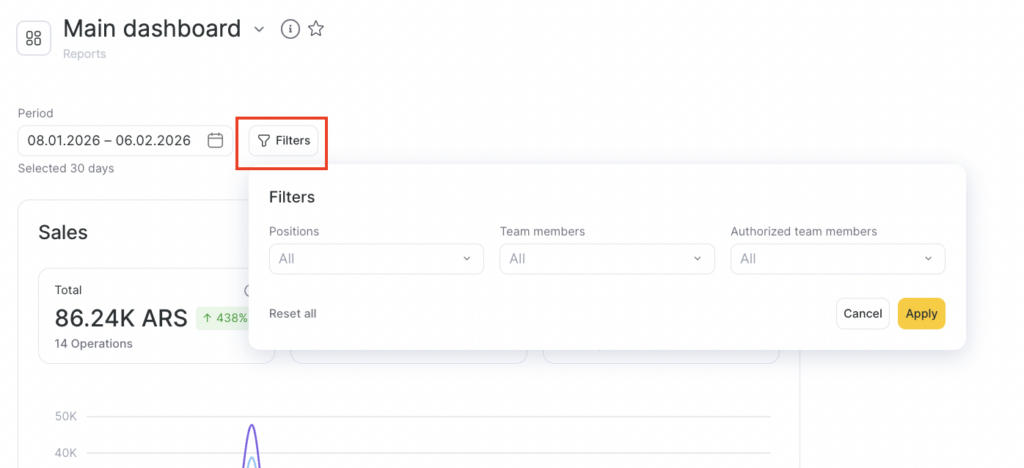
- Apply the needed filters and click Apply.
Available filters:
- Period
- Team member
- Authorized team members
- Position
This way, for example, you can view metrics for a specific team member only.
Sales section #
The Sales section shows revenue and average values.
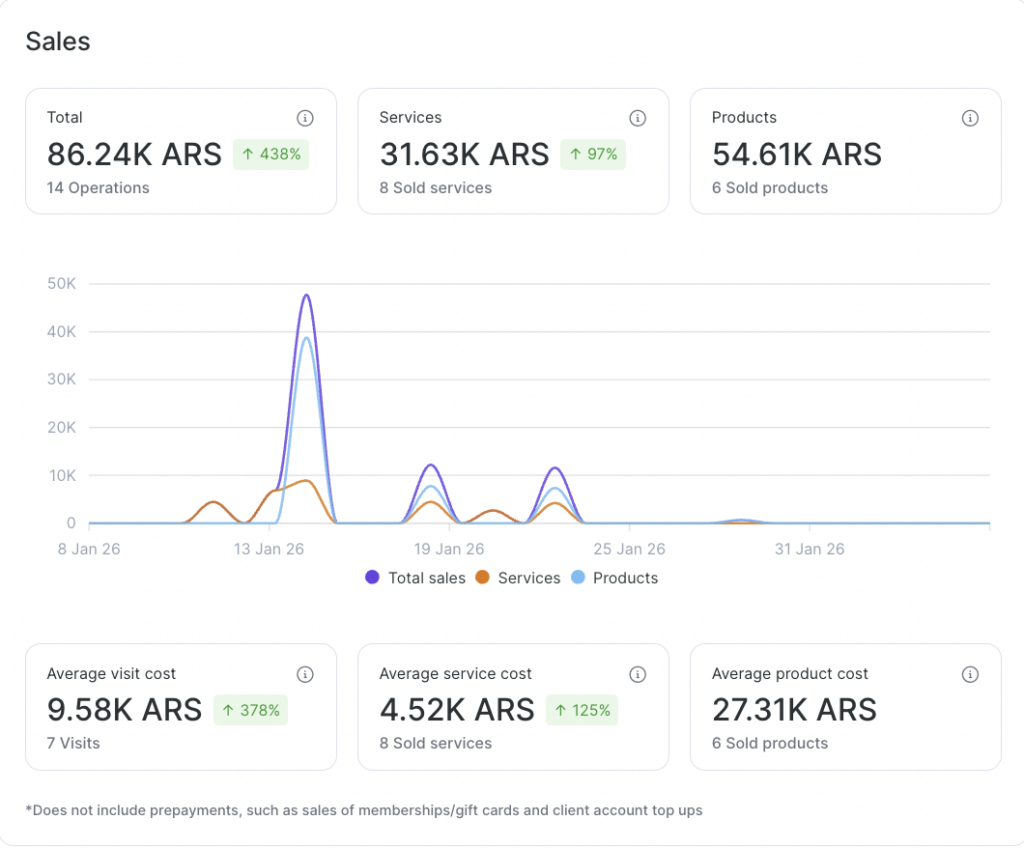
Each metric includes a tooltip with details on how it is calculated. Click the i icon to open the explanation.
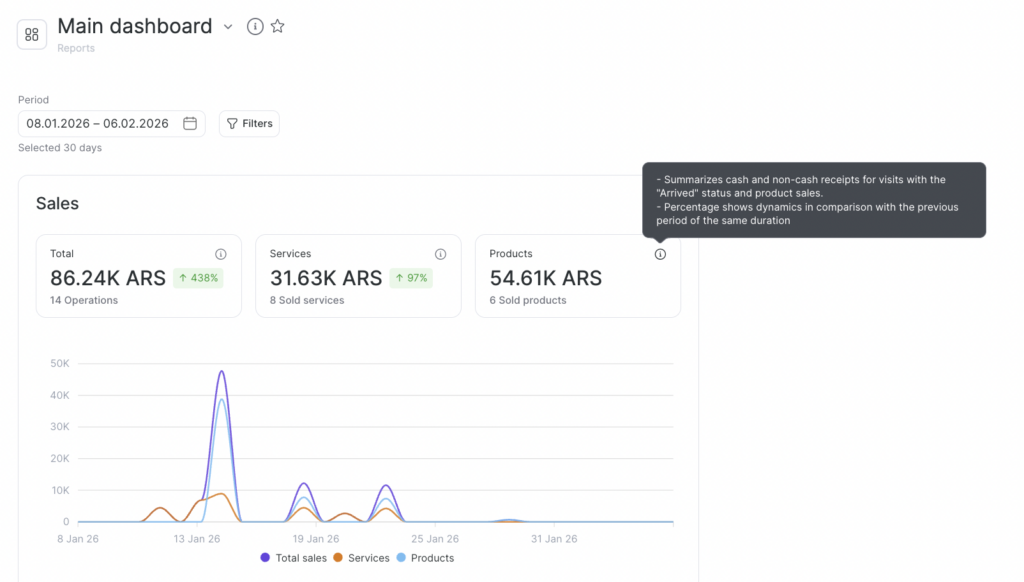
- Total — the total amount of income for the selected period. Includes cash and cashless payments for visits with the status “Arrived”, plus product sales.
- Services — revenue from provided services. Includes cash and cashless payments for visits with the status “Arrived.”
- Products — revenue from product sales. Includes the value of products sold during visits with the status “Arrived”, plus product sales outside a visit.
- Average visit cost — calculated as:
(Service revenue + Product revenue) ÷ (Visits with clients + Appointments without clients + Product sales) - Average service cost — calculated as:
Service revenue ÷ (Visits with clients + Appointments without clients) - Average product cost — calculated as:
Product revenue ÷ (Visits with clients + Product sales)
Note
Prepayments are not included in calculations: sales of memberships, certificates, and personal account top-ups.
Attendance section #
Only appointments with the status “Arrived” are used to calculate the metrics. Appointments without an assigned client are not included.
The Attendance section reflects client activity during the selected period and helps you track visit dynamics and changes in your client base.
All metrics show the change (in %) compared to the previous same-length period.
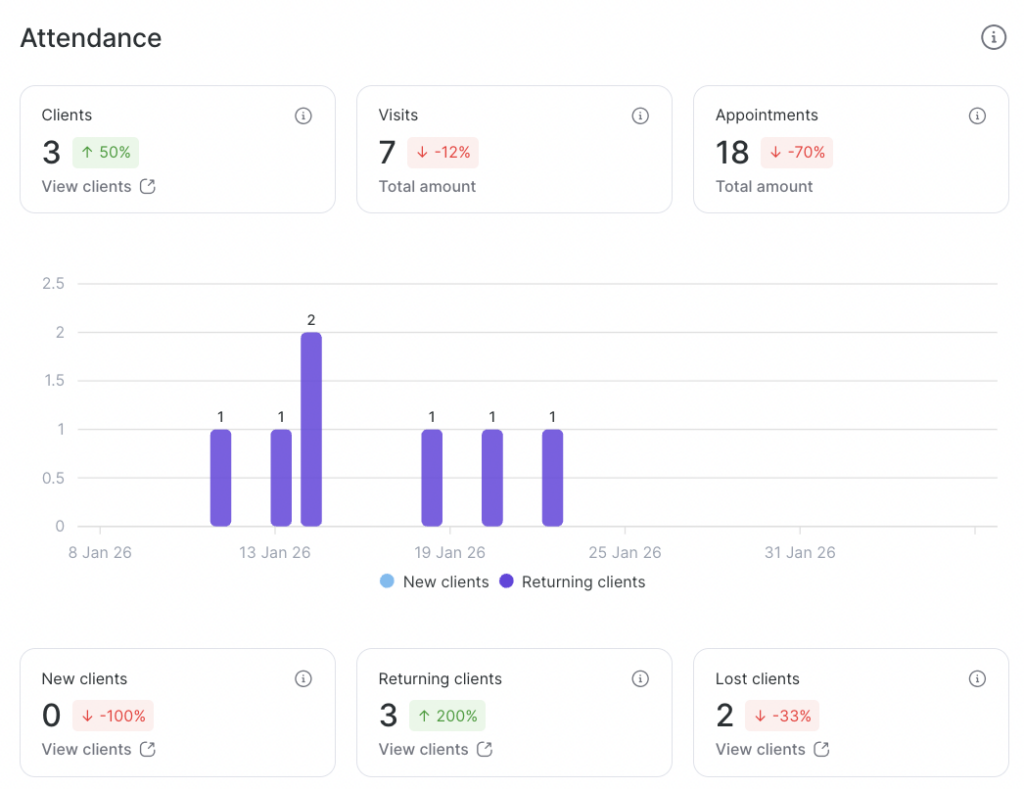
- Clients — number of unique clients who visited during the selected period. If the same client visited multiple times or booked with different team members, they are counted only once.
- Visits — total number of actual visits during the selected period. The same client may be counted multiple times if they visited more than once.
- Appointments — total number of appointments created during the selected period, including cancelled ones.
- New clients — number of clients who made their first visit during the selected period.
- Returning clients — number of clients who made their second and subsequent visits during the selected period.
- Lost clients — number of clients who did not visit for a certain number of days. The “lost” period is configured in the Setting section > Analytics > Churn Rate.
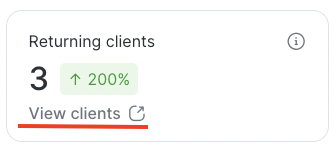
Client list #
In the metric cards, there is a View clients link.
When you click it, you’ll be taken to the client list where you can see the list of clients corresponding to the selected metric and period.
Occupancy section #
The Occupancy section shows how efficiently working time is used.
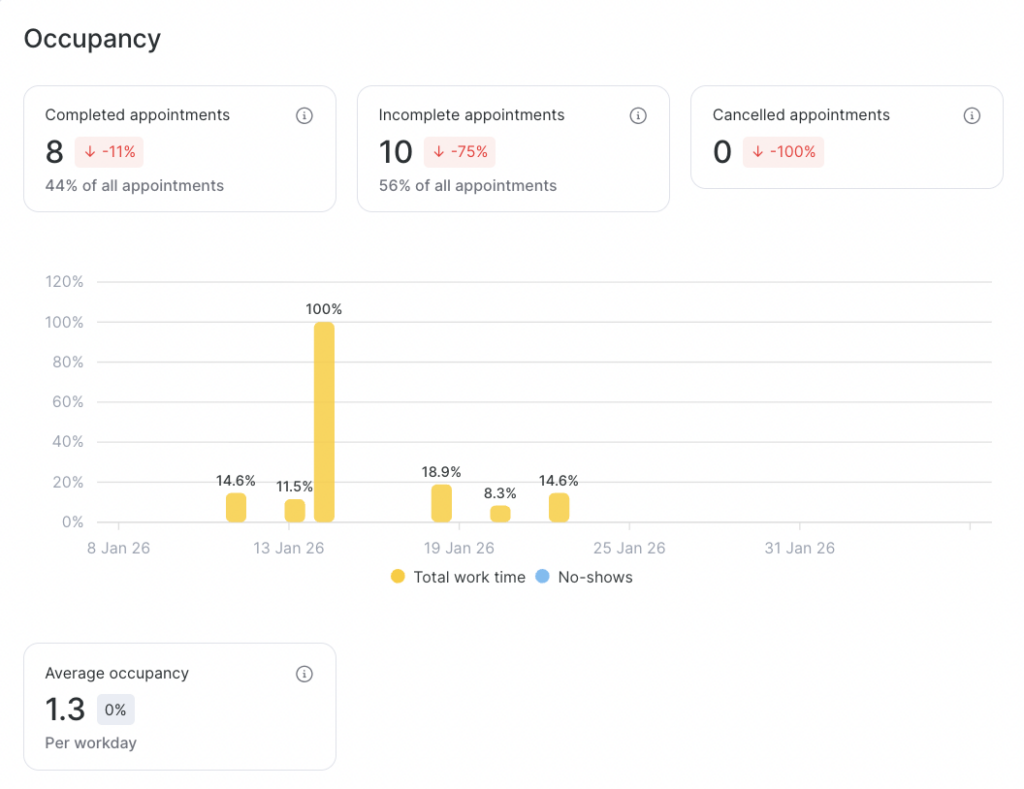
The workload chart displays:
- the percentage of occupied working time,
- gaps (unfilled time slots),
- and helps evaluate team member’s real workload.
- Completed appointments — number of appointments with the status “Arrived.” These are the visits that actually happened.
- Incomplete appointments — number of appointments with statuses “Confirmed” and “Pending.” These were created but had not yet resulted in a completed visit at the time of analysis.
- Cancelled appointments — number of manually cancelled appointments and appointments with the status “No-show.” Helps assess the share of cancellations and no-shows.
- Average occupancy — the average percentage of team member workload per workday. Calculated as:
Total duration of appointments with the status “Arrived” ÷ Total duration of team members’ working time
This helps you understand how effectively the team’s work time is being used.
Important #
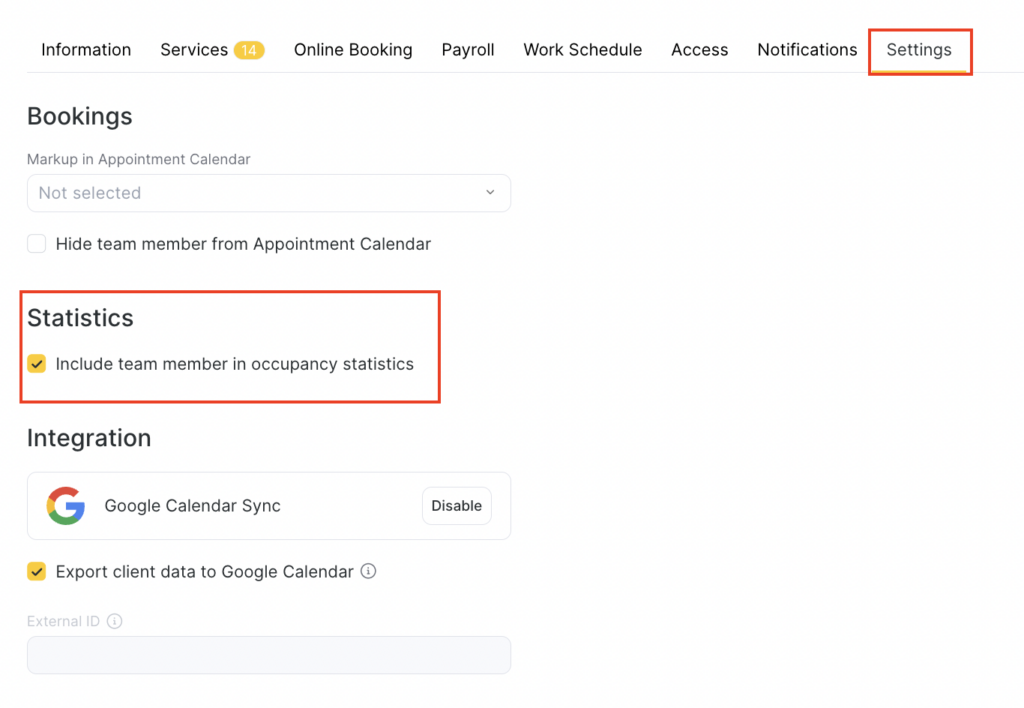
Average occupancy may be calculated incorrectly if the schedule includes team members who do not provide services (for example, administrators) but have working hours set. They have no appointments, but they still appear in the statistics.
You can exclude such team members from occupancy statistics by disabling the checkbox in the team member settings under:
Statistics > Include team member in occupancy statistics (see the Statistics section of the related article).
The Main Dashboard report helps you:
- make management decisions based on data
- monitor revenue and average check
- track changes in your client list
- analyze team member workload
- spot periods of decline or growth