The Breakdown by Locations report provides detailed analytics for each branch within the chain over a selected period. It helps owners and managers compare performance across locations, identify trends, and analyze key operational indicators such as revenue, average ticket, occupancy, and client activity.
You can use this report to evaluate location efficiency, track performance changes, and make data-driven decisions about staffing, marketing, and service distribution.
Where to find the report #
- Navigate to Analytics > Breakdown by Locations.
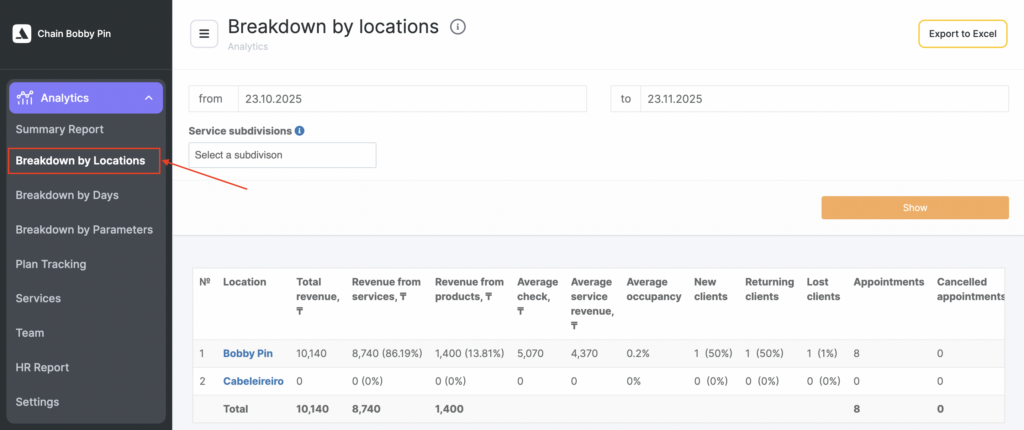
- Select the reporting period and, if needed, filter by Service Subdivisions, then click Show to generate the data.
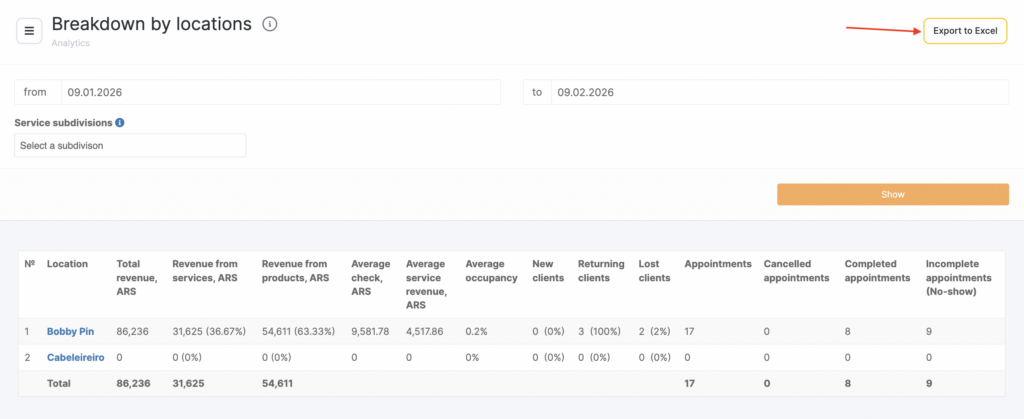
- You can also export the results as a spreadsheet using the Export to Excel button.
How the metrics are calculated #
The report displays a table containing detailed metrics for each location. Below is a breakdown of each metric and how it is formed.
Revenue Metrics #
1. Total Revenue
The total value of all services and products sold during visits with the status “Arrived”, plus product sales made outside of a visit.
2. Service Revenue
The total value of services provided during visits with the status “Arrived.”
3. Product Revenue
The total value of products sold during visits with the status “Arrived,” plus product-only sales made outside of a visit.
Note
Revenue metrics include all “Arrived” visits whether or not a phone number is present.
Phone numbers are only required for correct calculations related to client-specific statistics (e.g., average ticket per customer).
Average Check #
1. Overall Average Check
Service + product revenue for the period divided by:
(Visits with clients + Bookings without clients + Product sales)
2. Service Average Check
Service revenue divided by:
(Visits with clients + Bookings without clients)
Only visits and product sales that include a phone number are used in these calculations.
Revenue used for average ticket is not displayed as a separate metric.
Average Occupancy #
Shows how efficiently each location uses its schedule.
Calculated as:
Total duration of “Arrived” visits / Total working hours
Important
If team members who do not provide services (e.g., receptionists) are added to the schedule with working hours, the occupancy percentage may be incorrect, because they have zero bookings but count toward total working time.
To exclude such team members, disable the setting in the team member card Statistics > Include in occupancy
Client Metrics #
1. New Clients
The number of clients who made their first visit during the selected period.
2. Returning Clients
The number of clients who made their second or later visit during the period.
3. Lost Clients
The number of clients whose last visit occurred in a previous period equal in length to the selected one, and who have not returned within the returnability window defined in:
Analytics > Settings > Client Churn
Phone number is required for clients to be counted.
Booking and Visit Metrics #
1. Total Bookings
All appointments created within the period, including cancelled or deleted ones.
2. Cancelled Bookings
All bookings that were cancelled or deleted, plus all visits with the status No-show.
3. Completed Visits
All visits with the status Arrived.
4. Uncompleted Visits
Visits in statuses:
- Pending
- Confirmed
Location Comparison Overview #
The table displays all metrics side by side for each location, allowing you to compare:
- Revenue structure
- Client acquisition and retention
- Number of visits and cancellations
- Occupancy
- Service vs. product performance
At the bottom, a Total row aggregates metrics across all locations.
Exporting Data #
You can download the full report in Excel format using the button Export to Excel.
This allows for deeper analysis, pivot tables, or sharing with finance teams and managers.