
What is it and what is it for? #
The Analytics > Analytical Reports > Sales by Services section displays statistics on all services provided for a certain period. This section helps to analyze which service is more in-demand and produces more revenue, and which one does not make a profit for the company, therefore, it can be removed or timely measures can be taken.
Important
Statistics is generated only for bookings with the Arrived status.
The report contains the following information:
- Service
- Number of provided services
- Discount paid
- Paid from client accounts
- Paid via card or cash
- Cost consumables
- Payroll
- Profit
- Revenue contribution in percentage
How to read the report? #
To generate a report, go to the Analytics > Analytical Reports > Sales by Services section. Filter the list by the required items and click the Show button.
Filters that can be used in the report:
- Period
- Team members
- Service categories
- Detailing by services or categories
Thus, you can check, for example, a report on the revenue of a certain team member for one service.
In the Revenue contribution % column, you can open a data chart that displays the days this service was more popular and produced more revenue. To do this, click the  button on the right.
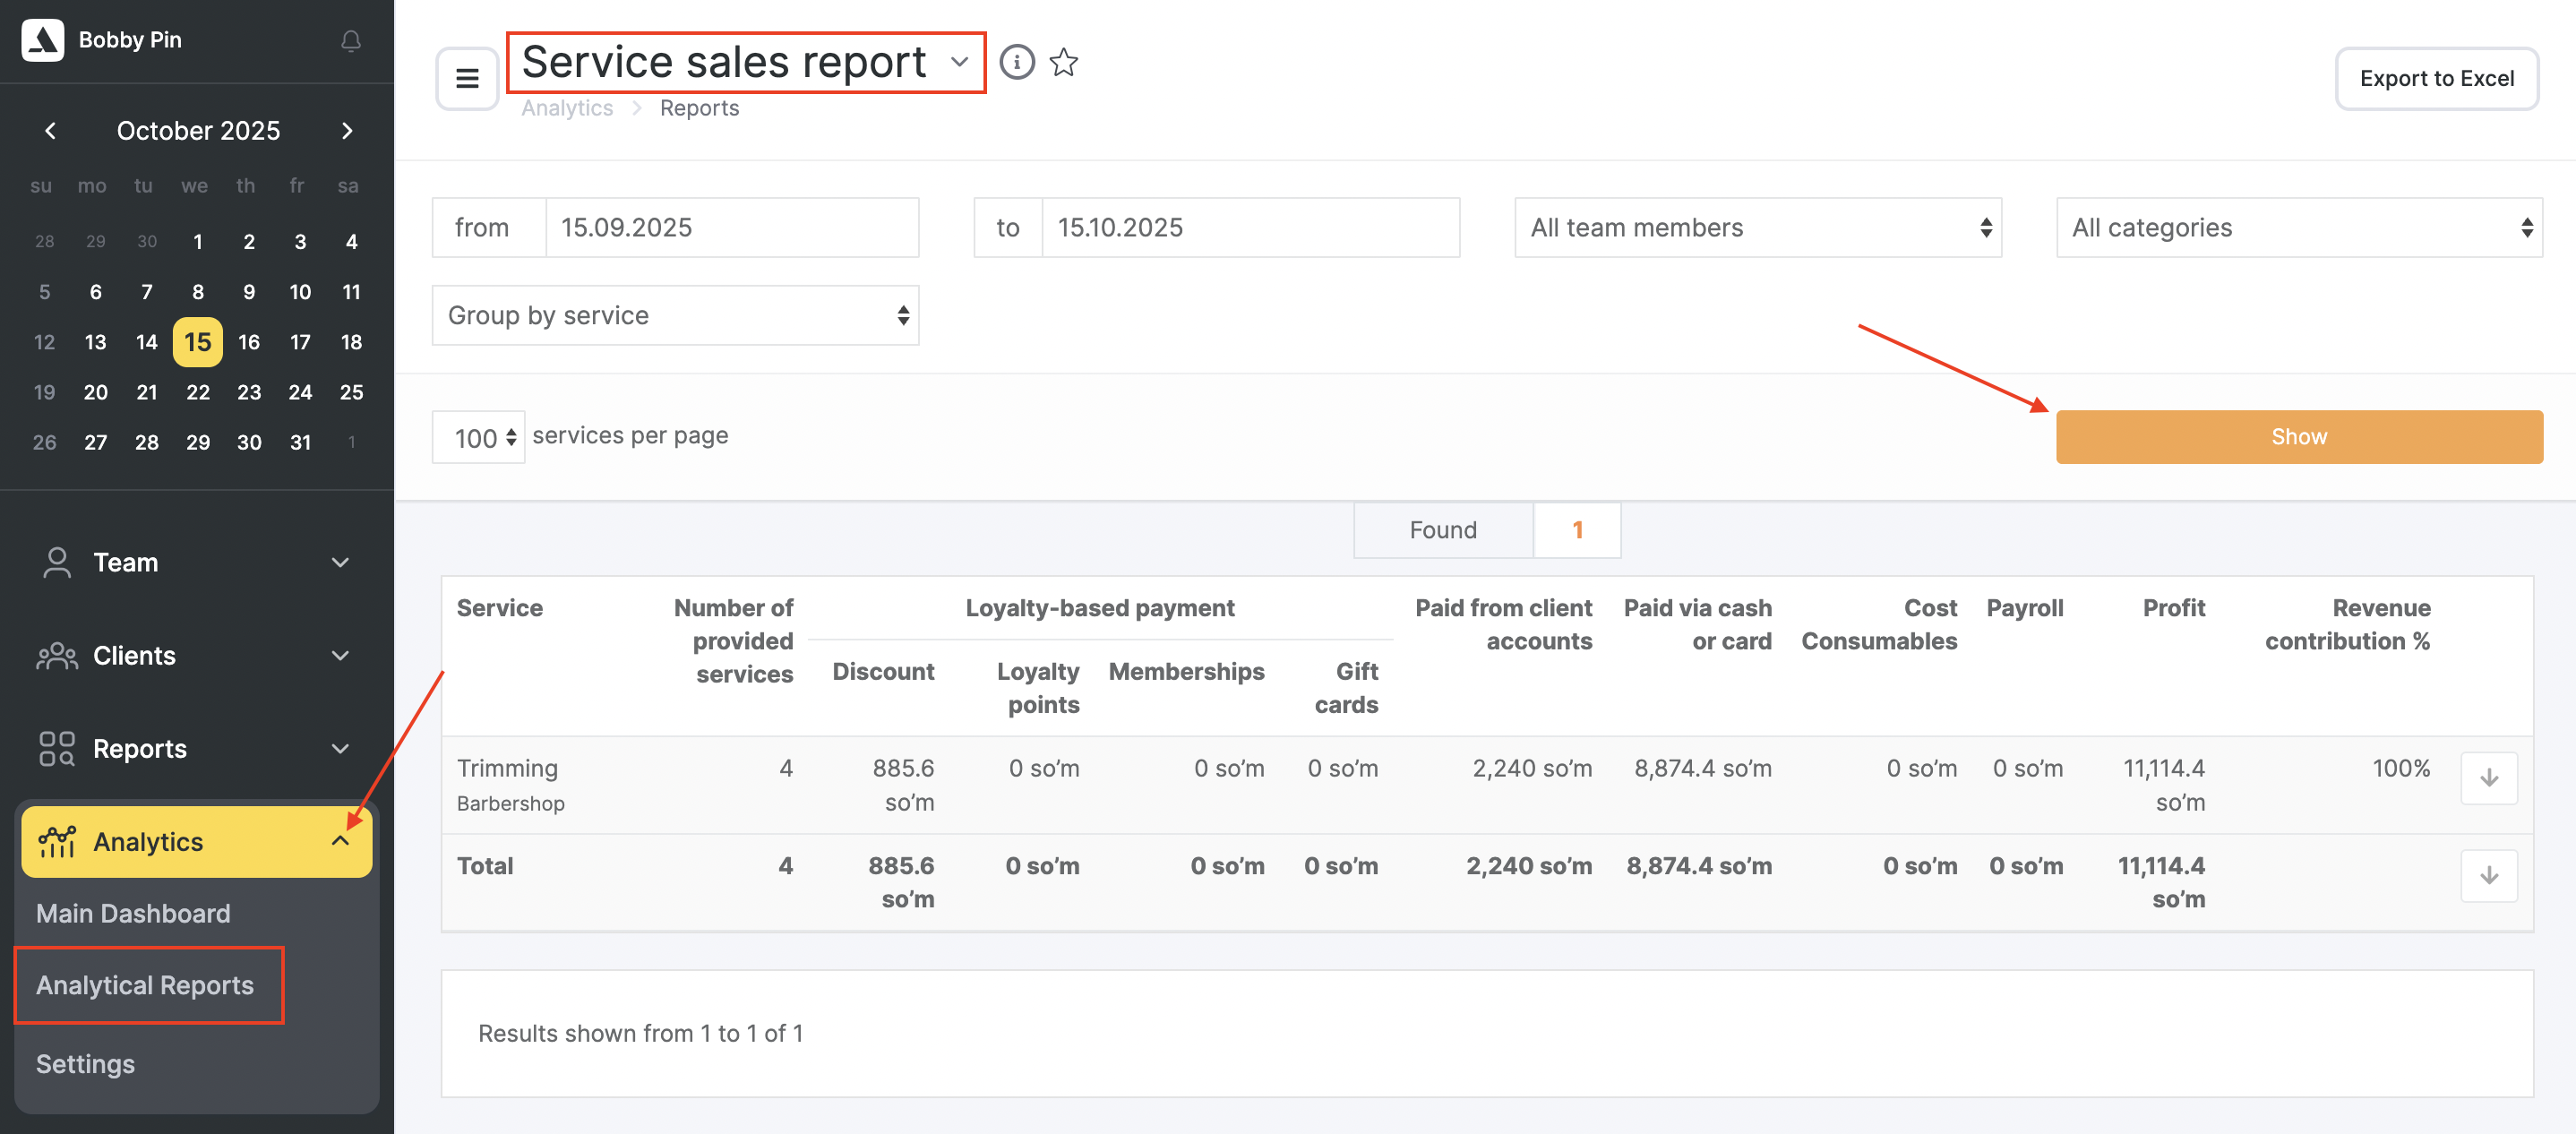
If necessary, the report can be downloaded as Excel.