
What is it and what is it for? #
The Analytical Reports > All reports > Sales> By Clients section displays data on revenue and visits of all clients who used the company’s services for a certain period.
Important
Statistics is generated only for appointments with the Arrived status.
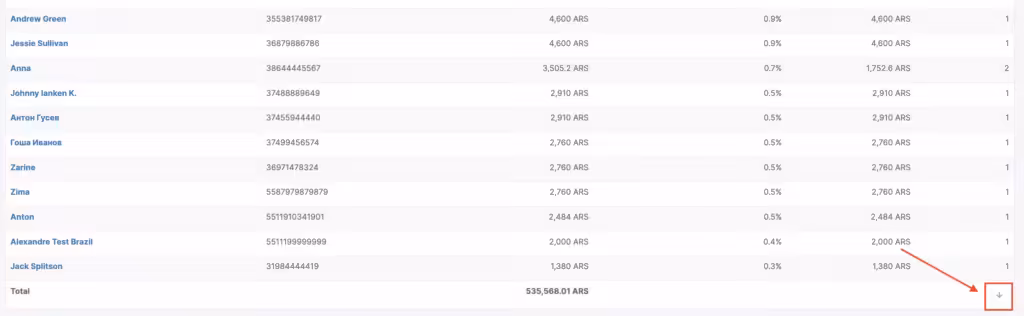
The report contains the following information:
- Client
- Earnings
- Percentage of the total revenue
- Average spend
- Number of visits
Also here you can see the total amount of earnings.
How to read the report? #
To generate a report, go to the Analytics > Analytical Reports > Sales by Clients section. Specify the period for which you want to see the report, and click the Show button.
In the line with the total amount of earnings, you can open a data chart that displays when clients were the most active. To do this, click the  button in the bottom right corner.
If necessary, the report can be downloaded as Excel by clicking the Excel actions button.
Client data can be downloaded with or without a visit history.