The Breakdown by Parameters report allows you to analyze any single metric across all locations, with day-by-day detail for the selected period.
You choose one parameter (e.g., revenue from sold, average spend, new clients, cancelled appointments), and the system builds a table showing how this value changed across dates and locations.
This report is ideal for deep analytical work, such as:
- tracking performance trends,
- identifying peaks or drops,
- comparing locations by one specific metric,
- monitoring staff or operational efficiency,
- evaluating the effects of promotions, price changes, or scheduling adjustments.
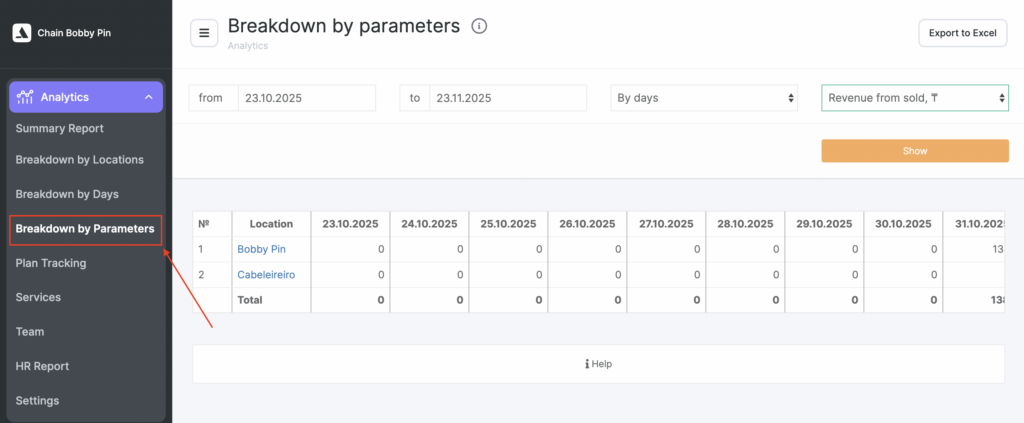
Where to find the report #
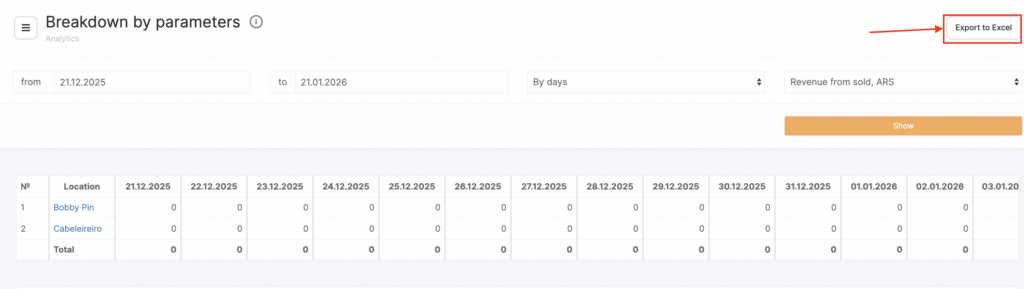
- Go to Analytics > Breakdown by Parameters
- Select the date range and choose one parameter from the dropdown.
- Click Show to generate the report.
You can export the table using Export to Excel.
How the report works #
The report displays a table where:
- Columns = dates within your selected period
- Rows = locations
- Cells = metric value for a specific location on that specific day
A Total row at the bottom summarizes the value for each day across all locations.
Available parameters #
The following metrics are available for analysis:
Revenue Metrics #
- Revenue from sold
The value of services and products sold during visits with the status “Arrived”, plus product-only sales outside visits.
- Revenue from paid
The total amount actually paid by clients during the selected period (only completed, paid transactions).
Average Check & Occupancy #
- Average spend
Average check calculated based on visits and product sales that include a client phone number.
- Average occupancy
Ratio of the total duration of “Arrived” visits to the total working hours of team.
Client Metrics #
- New clients
Clients who made their first visit on that day.
- Returning clients
Clients who made their second or subsequent visit.
- Lost clients
Clients whose last visit falls into the previous period of the same length (based on returnability settings).
Appointments and Visits #
- Appointments
All created appointments, including cancelled ones.
- Cancelled appointments
Cancelled/deleted appointments + visits with the status “Client didn’t come” (No-show).
- Completed appointments
Visits with the status “Client came.”
- Incomplete appointments (No-show)
Visits in statuses:
- “Pending”
- “Confirmed”
How to use this report #
The Breakdown by Parameters report helps you:
- Analyze a single KPI in depth
- Compare how locations perform in one specific metric
- Identify problematic days or unusual spikes
- Evaluate staff efficiency, marketing impact, and operational changes
- Monitor achievement of goals and performance plans
This report is especially powerful when combined with Summary Report, Breakdown by Days, and Breakdown by Locations.
Exporting data #
Use Export to Excel to continue working with the data in spreadsheets, build charts, prepare presentations, plan staffing, or perform financial analysis.