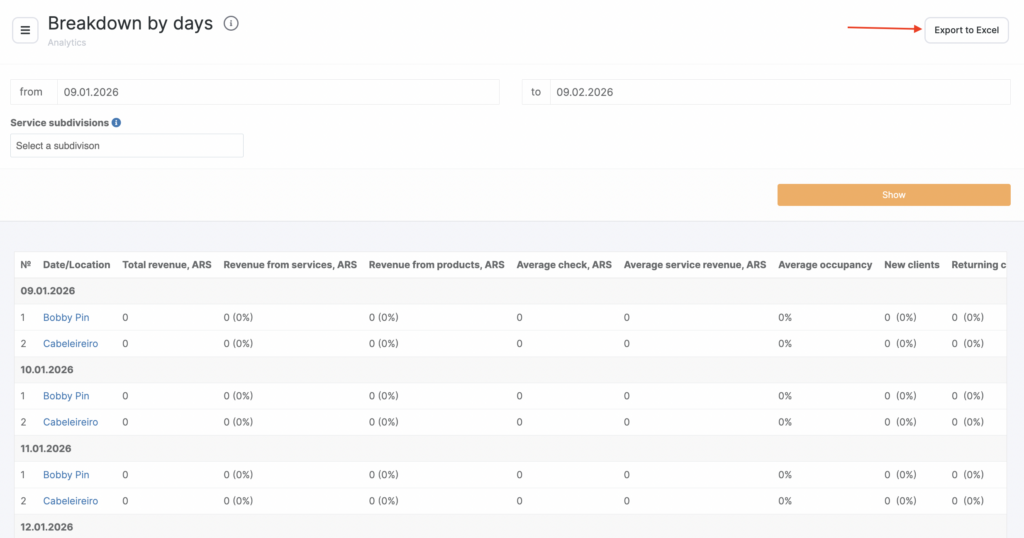
The Breakdown by Days report provides detailed performance analytics for each location, grouped by individual dates within the selected period. This report helps you track daily dynamics: revenue, occupancy, average check, and client activity for every location on a day-by-day basis.
It is especially useful for identifying patterns such as peak days, slow days, seasonal behavior, the impact of promotions, staff schedules, or external events on daily performance.
Where to find the report #
- Navigate to Analytics > Breakdown by Days
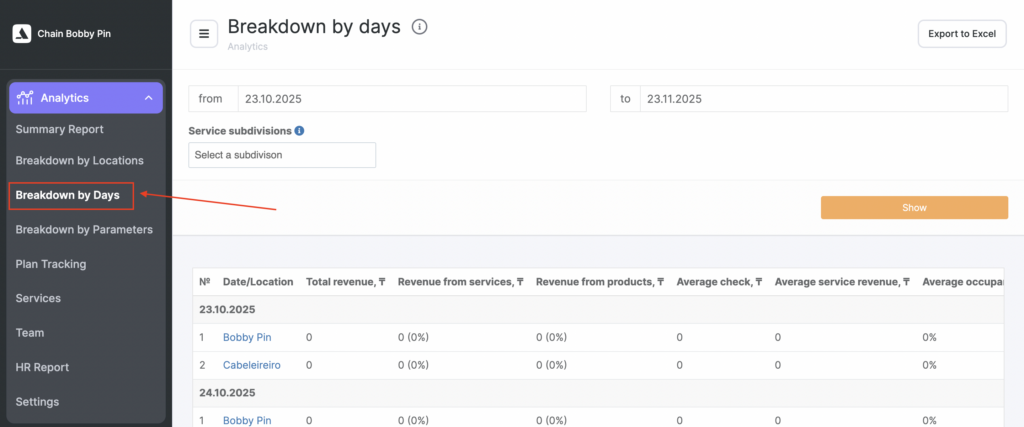
- Select the date range and, if needed, filter by Service subdivisions, then click Show to generate the report.
- You can also export the data using Export to Excel.
Report structure #
The report displays a table where all data is grouped by day.
Within each date block, you will see a list of locations with their corresponding metrics for that specific day.
For each location on each date, the following indicators are shown.
Description of metrics #
The set of metrics is consistent with the logic used in Summary Report and Breakdown by Locations.
Total Revenue #
The total combined value of services and products sold during visits with the status “Client came”, plus product sales recorded outside of visits.
Includes: #
- Revenue from services — cost of services performed
- Revenue from products — products sold during visits and outside of visits
The percentage values show the share of revenue from services and products out of the total revenue for that specific day and location.
Important
Revenue is calculated regardless of whether a phone number is attached to the visit.
Phone numbers are required only for client-related indicators and average check calculations.
- Average check
Calculated as:
(Revenue from services + revenue from products) / (visits with clients + bookings without clients + product sales)
- Average service revenue
Calculated as:
Revenue from services / (visits with clients + bookings without clients)
Only visits and product sales with a phone number attached are included in the calculation.
The revenue used for calculating average check is not displayed as a separate metric.
- Average occupancy
This metric reflects how efficiently the working schedule of the location was used on that specific day.
Calculated as:
Total duration of “Arrived” visits / total working hours
Important
If team members who do not provide services (such as administrators) have working hours in the schedule, the occupancy percentage may appear incorrectly low. Such team members should be excluded. To do this, go to Team settings > Statistics > Include team member in occupancy and uncheck the box.
How to read the report #
Daily grouping #
Each date appears as a separate block (e.g., 23.10.2025), listing all locations and their performance metrics for that day.
Comparison within a specific day #
This allows you to immediately see:
- which location performed best on that date,
- whether certain days of the week are consistently strong/weak,
- whether promotions, holidays, weather, or staffing affected performance.
Daily dynamics #
By scrolling through the table, you can analyze:
- day-to-day performance changes,
- workload fluctuations,
- productivity trends,
- how staffing or schedule adjustments impact results.
Exporting data #
You can download the full dataset using Export to Excel.
This is helpful for deeper analysis, graph creation, presentations, budgeting, and comparing performance across locations.